
The City of Albuquerque has a 311 service that can be reached by calling 311. They have also use SeeClickFix for web and app based submitting. This post will show you how to query the SeeClickFix API to retrieve Albuquerque Data.
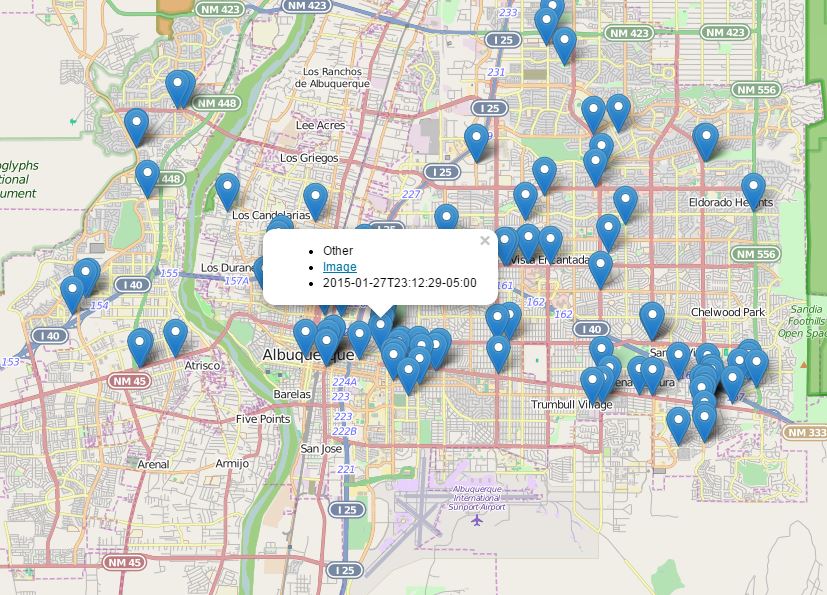
The finished Application
The API
The SeeClickFix API is rather uncomplicated. You can find the details on their development site. To see issues, you will call the API by going to the issues service and passing parameters.
The code above grabs a single issue on page 1. Change page to 2 and it will be a different issue. Change issues to 100 and you will hit the maximum of issues per page. Look through the JSON and make not of the fields and also that the addresses are for cities throughout the country – not just Albuquerque.
Using the API for Albuquerque Data
To narrow the data for Albuquerque, you could grab all the data and filter based on address but that would require reading TONS of data. Not the way to go. Using the API, we can filter by an envelope. The coordinates for a bounding box around the City of Albuquerque are (35.02212, -106.79672),(35.20636, -106.48911). Using the API, we can enter the URL below and get back some issues for Albuquerque.
I will add that I want only open tickets on page 1 with 100 records on the page.
Now you should see 100 open 311 issues in the City of Albuquerque.
Mapping the Data
With the URLs working for our requests, we can automate calling them using AJAX and parse out the response to display the points on a leaflet.js map. I have covered how to do this multiple times on this blog, but the code is below.
http=new XMLHttpRequest();
http.open(“GET”, url, true);
http.setRequestHeader(“Content-type”, “application/x-www-form-urlencoded”);
http.onreadystatechange = function() {
if(http.readyState == 4 && http.status == 200) {
console.log(http.responseText);
var result= JSON.parse(http.responseText);
for(x=0;x<Object.keys(result.issues).length;x++){
markers.addLayer(L.marker([result.issues[x].lat,result.issues[x].lng]).bindPopup(“<ul><li>”+result.issues[x].summary+”</li><li><a href='”+result.issues[x].media.image_full+”‘>Image</a></li><li>”+result.issues[x].created_at+”</li></ul>”));
}//end for
markers.addTo(map);
}}
http.send();
The code above makes the request, parses the response as JSON then grabs the coordinates. When creating the marker, I went ahead and added some other fields in a popup so that we could have more information about the request.
In a future post, I will show you how to post to SeeClickFix to report a problem.
